
An overview by Samuel Varney
Hooke’s law History,
not to be confused with James hook.“Hooke’s law, law of elasticity discovered by the English scientist Robert Hooke in 1660, which states that, for relatively small deformations of an object, the displacement or size of the deformation is directly proportional to the deforming force or load. Under these conditions the object returns to its original shape and size upon removal of the load. Elastic behaviour of solids according to Hooke’s law can be explained by the fact that small displacements of their constituent molecules, atoms, or ions from normal positions is also proportional to the force that causes the displacement.”
source: https://www.britannica.com/science/Hookes-law
more on Robert Hookes life please watch the video below
video: https://www.youtube.com/watch?v=_JSF55vQ7Ps
Hooke’s law
F=kx
“Where F is the force, x is the length of extension/compression and k is a constant of proportionality known as the spring constant which is usually given in N/m”… “When calculating x, it is important to remember that the spring itself will also have some nominal length L0, The total length of a spring under extension is equal to the nominal length plus the extension, x=L0 + L▲ . For a spring under compression, it would be x=L0-L▲.”
Calculating k value with Young’s modulus:k=E*(A/L)
E=ϵ/σ=Strain/Stress“Young’s modulus can be defined at any strain, but where Hooke’s law is obeyed it is a constant. We can directly obtain the spring constant k from the Young’s modulus of the material E, the area A over which the force is applied (since stress depends on the area) and nominal length of the material L.”
source: https://www.khanacademy.org/science/physics/work-and-energy/hookes-law/a/what-is-hookes-law
for more information on hooks law and practical experiment please look at the following video:
video: https://www.youtube.com/watch?v=QQCJeAqBumE
The experiment
An experiment has been carried out on three materials Y1, Y2 and Z1 to test their elastic properties, Y1 and y2 are extended within their elastic limits while z1 is extended beyond its elastic region initiating plastic properties ( “Stresses beyond the elastic limit cause a material to yield or flow”.)
http://edshare.soton.ac.uk/19483/14/assignment-1-2018-hookes-blog%20Specification.pdf
https://www.britannica.com/science/elastic-limit
The results:
| x=Force (N) | y1 = ax + b | y2 = (a + 0.5)x + c | z = x^3 + b |
| 1 | 3 | 2.2583 | 2.375 |
| 2 | 4.5 | 4.3166 | 9.375 |
| 3 | 6 | 6.3749 | 28.375 |
| 4 | 7.5 | 8.4332 | 65.375 |
| 5 | 9 | 10.4915 | 126.375 |
| 6 | 10.5 | 12.5498 | 217.375 |
| 7 | 13 | 14.6081 | 344.375 |
| 8 | 14 | 16.6664 | 513.375 |
| 9 | 15 | 18.7247 | 730.375 |
From the table above we can see that y1 had the most elasticity to start then after 3 newtons became the most rigid material at 9 newtons only stretching 15 mm while material y2 had stretched 18.7247 mm, nearly a 20% increase.
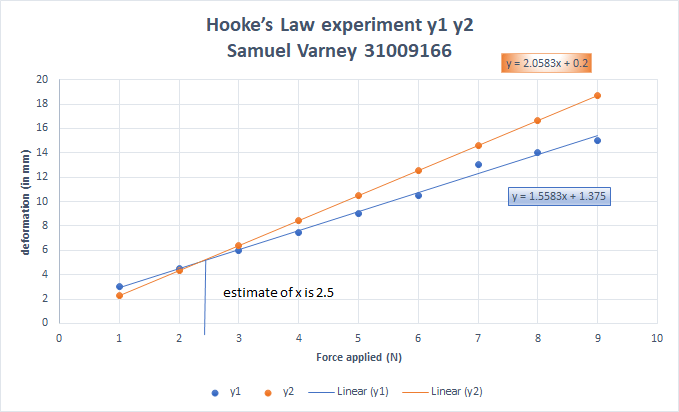
From the graph we see Y1= ax+b,
Y1=1.5583x+1.375
a= 1.5583
b=1.375I predicted from the graph that the x intercept would be 2.5 Newtons:
resolving simultaneously: y1 and y2
The real x intercept of 2.35 Netwons
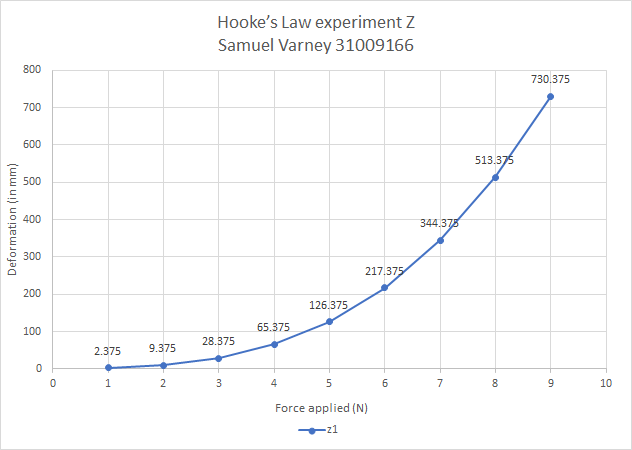
Unlike graph y1 and y2 the experiment z graph shows of a material being taken beyond its elastic limit and causing to yield meaning that it will not return to its original shape after the force has been removed.
Conculsion
From viewing the results from the graph y1 y2, I noted some variances especially in y1’s tend line this is maybe because of 3 potential errors 1. there may of been rounding errors when calculating the extension of Y two the force applied. 2. there may of been a measuring error of weights or scale being not properly calibrated. 3. potential of recording inaccurate information through human error.
